The Coal Cost Crossover: Economic Viability Of Existing Coal Compared To New Local Wind And Solar Resources – Energy Innovation: Policy and Technology

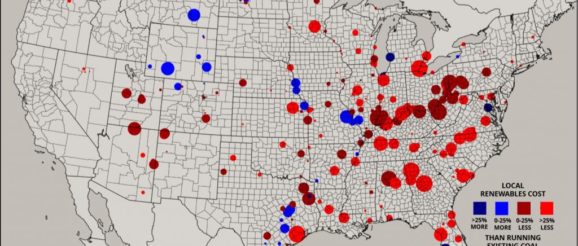
America has officially entered the “ coal cost crossover ” – where existing coal is increasingly more expensive than cleaner alternatives. Today, local wind and solar could replace approximately 74 percent of the U.S. coal fleet at an immediate savings to customers. By 2025, this number grows to 86 percent of the coal fleet.
This analysis complements existing research into the costs of clean energy undercutting coal costs, by focusing on which coal plants could be replaced locally (within 35 miles of the existing coal plant) at a saving.
It suggests local decision-makers should consider plans for a smooth shut-down of these old plants—assessing their options for reliable replacement of that electricity, as well as financial options for communities dependent on those plants.
This report should begin a longer conversation about the most cost-effective replacement for coal, which may include combinations of local or remote wind, solar, transmission, storage, and demand response.
Full research report and appendices detailing the “ Coal Cost Crossover ,” where rapid wind and solar price declines have made the combined going-forward costs of existing coal-fired power plants more expensive than the all-in costs of building new renewable energy generation. This analysis was prepared by Energy Innovation and Vibrant Clean Energy. The Coal Cost Crossover: Economic Viability Of Existing Coal Compared To New Local Wind And Solar Resources
Maps: Cost of operating existing coal compared to building new local renewables
High-resolution maps detailing the marginal cost of energy (MCOE) in 2018 and 2025 for existing U.S. coal-fired power plants compared with building new wind or solar generation resources within 35 miles. Coal MCOE risk map compared to new renewables LCOE, 2018 Coal MCOE risk map compared to new renewables LCOE, 2025
Maps: Cost of building new wind and solar generation
High-resolution maps detailing the levelized cost of energy (LCOE) in 2018 and 2025 for building new wind or solar generation resources within 35 miles of existing U.S. coal-fired power plants. Solar LCOE map in 2018 Wind LCOE map in 2018 Solar LCOE map in 2025, using cost assumptions from NREL 2018 Annual Technology Baseline, low case. Wind LCOE in 2025, using cost assumptions from NREL 2018 Annual Technology Baseline, low case .
Datasets: Coal, solar, and wind datasets
Plant-by-plant estimates of the current MCOE for all existing U.S. coal-fired power plants detailing all going-forward operational costs, as well as current and future LCOE data for building new wind and solar projects on a fine resolution scale, both available for 2018 and 2025. Coal cost crossover dataset
