Visualizing Congressional Productivity – Center for Data Innovation

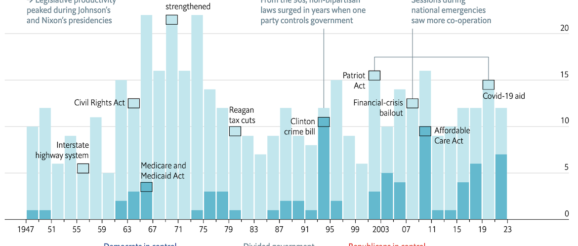
The Economist has created a visualization tracking productivity in the U.S. Congress. The visualization shows the number of major bills passed in every session of Congress from 1947 to 2023 as well as the party that held control over the House, Senate, and presidency during each session. In the visu
