ARK Innovation ETF (ARKK): How To Trade This Bubble (NYSEARCA:ARKK) | Seeking Alpha

Viktor_Gladkov/iStock via Getty Images
I think it is about time that we agree on one thing: the ARK Innovation ETF (ARKK) was a classic case of market bubble. Not unlike Japanese stocks in the 1990s, the dot-com mania in the 2000s and bitcoin (OTC:GBTC) in the 2010s, ARKK deserves a mention in the finance textbook as another case of frenzy that has not ended well, version 2020s.
This is not to say, however, that there is no money to be made in ARKK going forward. This is especially true if mega-growth, high valuation stocks eventually make a comeback – like internet stocks and cryptocurrencies did, many months or even years after their initial demise.
Today, I talk about how I believe one should use price action to trade ARKK.
Yes, it was (or is) a bubble
The definition of a bubble, according to Investopedia, is a “cycle that is characterized by the rapid escalation of market value, […] followed by a quick decrease in value, or a contraction, that is sometimes referred to as a crash or a bubble burst.” Visually, a bubble looks to me like the graph below, which depicts the parabolic journey of ARKK against the performance of the S&P 500 (SPY) and Nasdaq (QQQ) since the start of the COVID-19 crisis:
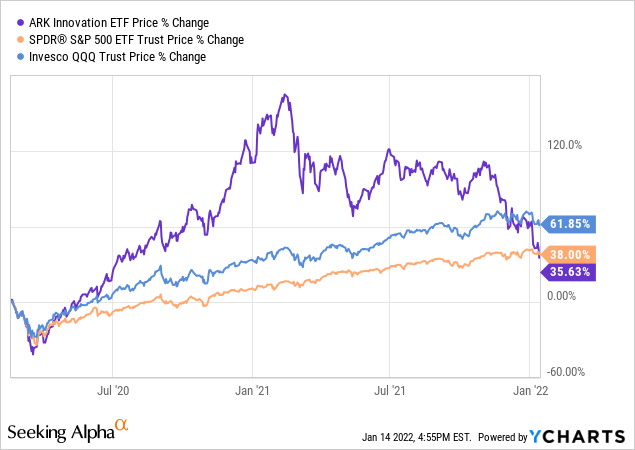
ARKK and its managers were frequently heralded as the “rockstars” of investing until as recently as March 2021. Now, the fund is underperforming even the S&P 500 since the start of the pandemic, let alone its more applicable benchmark, the tech-rich Nasdaq 100.
Don’t catch the falling knife
If you had to pick three names out of the top 10 holdings of the following ETFs and hold them for the next 20 or 25 years, from which “pool of stocks” would you fish: ARKK or, say, Vanguard Value (VTV)?
I would probably go with the former. In my view, the long-term prospects of companies that are leaders or disrupters in sub-sectors, like electric and autonomous vehicles, digital currency and office productivity, are much more compelling. Sure: banking, oil and gas, and packaged good stocks could outperform in the near term. But I do not think that the most value creation over the long run will come from here.
Now, to me, this is only the answer to the first part of the question: should I buy ARKK at current levels? The second part, “at current levels”, is the tricky one. To explain why, let’s travel back to the dot-com era.
The Nasdaq peaked in March 2000, after having climbed a cumulative 500% in the previous five years (for reference, ARKK spiked 880% in the five years leading to February 2021). But by December 2000, the index had already lost 50% of its value from the peak. Does the magnitude and timing of the decline in tech stocks in the early 2000s remind anyone of ARKK twenty years later?
The problem for bold investors who bought the dip at that point is that the Nasdaq did not stop unwinding. In the following two years, the tech group shed another 28% and 38% of its value in 2001 and 2002, respectively. The index did not break through its December 2000 levels, never to dip below it again until December 2011 – that’s 11 years later!
To me, buying ARKK today is about as risky as buying the Nasdaq in December 2000. Only because stock prices have dropped as much as they have does not mean that (1) they cannot sink deeper and (2) investors who jump in now will not remain underwater for years to come.
The solution, in my view, is to wait for the market to tell when to buy the dip. Notice that bubbles are notorious for trending: on the way up first, then on the way down and, in many cases, on the way up again if the previous correction is overdone. The secret is to monitor price action and jump in only when momentum shifts to positive.
The chart below shows two different strategies: (1) just buying and holding the Nasdaq 100 through the entire bubble phase, from 1995 to the end of 2004, and (2) timing the purchases to when the price was above the 50-day moving average and selling shares below the trend line.
Nasdaq: Timed vs. Buy-Hold, 1995-2004
DM Martins Research
The difference in performance would have been remarkable: a $1,000 initial investment in the Nasdaq would have grown to $2,930 in ten years using the buy-and-hold method, but to a much higher $5,160 using the timed strategy. From peak to trough, buy-and-hold would have produced maximum loss of 78% that would have been much more painful than 39% using the moving average approach.
Timing entries and sidestepping selloffs would have also worked in the case of other bubbles. While the methodology would have prevented investors from fully riding the upside in the Nikkei bubble of the 1980s, it would have also minimized pain on the way down. Net-net, the timing strategy would have nearly doubled the annual returns of merely buying and holding Japanese stocks between 1985 and the end of 1994, while exposing investors to a maximum drawdown of only 20% vs. 63% in the base case.
Nikkei: Timed vs. Buy-Hold, 1985-1994
DM Martins Research
When to buy ARKK again
This conversation probably never happened:
Yet, I think this is exactly how ARKK should be traded today. Buying shares now and hoping for the best is not the ideal strategy, in my opinion. The tech-rich ETF could remain in the hole for many months, and maybe even dig a deeper one under its feet before it finally starts to recover.
The 50-day moving average approach suggests that ARKK should be bought once or if share price reaches $101.67 – understanding that this is a moving target that should be update each trading day (see chart below). Until then, I would not dare touch this ETF and risk getting stabbed by a falling knife.
ARKK: Share price and 50-day moving average, 2020-2022
DM Martins Research