Visualizing Coronavirus Testing in the United States – Center for Data Innovation

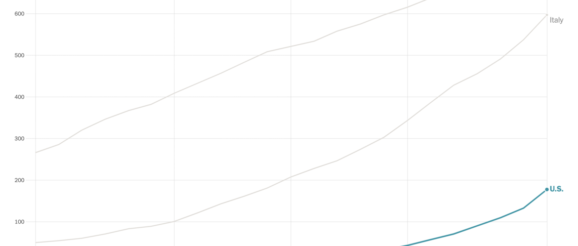
The New York Times has created a series of data visualizations illustrating how the United States is performing on coronavirus testing. The visualizations show that the United States has surpassed nations such as South Korea in the number of tests, but that it still lags in tests per capita. In addition, the visualizations show that there is a wide variance in the number of tests each state has conducted. For example, California, which has twice the population of New York, has conducted significantly fewer tests.
