Visualizing Food Preferences in the United States – Center for Data Innovation

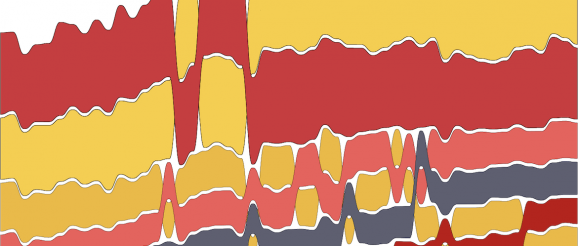
Flowing Data, an online publication that creates data visualizations, has created a series of visualizations depicting how food preferences have changed over time in the United States. The graphics use data from the U.S. Department of Agriculture to show consumer preferences in proteins, vegetables,
