Pharmaceutical innovation sourcing

A key aspect of debates about the efficiency of the biopharmaceutical industry in generating new medicines is the role of small and medium-sized enterprises (SMEs) and universities as sources of pharmaceutical innovation. Some of the most important recent therapeutics and vaccines did not emerge directly from large drug companies, but rather were acquired through asset licensing, buy-outs of biotech firms, or came from publicly funded academic spin-offs. Furthermore, SMEs play a pivotal role as innovation sources in high priority areas for public health, such as antimicrobial research and development (R&D). This has been highlighted in the COVID-19 pandemic, with crucial vaccines and drugs identified by academic institutions and/or SMEs being developed through partnerships with larger biopharma companies.
In this analysis, we examine a decade of regulatory approvals of new medicines in the European Union (EU), evaluating the contribution of different types of organizations and regions to pharmaceutical innovation, the role of SMEs in championing innovation, and how large pharma companies are harnessing external innovation in their pipelines. We focus our study of pharmaceutical innovation sourcing on EU-level approvals of medicinal products containing new active substances, which have never been previously authorized. We also investigate so-called incremental innovation and follow-on developments with a significant innovative profile, added value, or that respond to unmet medical needs (hereafter referred to as ‘new and innovative medicines’). For details of the dataset and analysis, see Supplementary Box 1 and Supplementary Table 1.
Analysis
Between 2010 and 2019, 777 marketing authorisation applications (MAAs) received a positive opinion from the Committee for Medicinal Products for Human Use (CHMP) at the European Medicines Agency (EMA). Of these, 369 medicinal products were new and innovative, as defined in this analysis. Most of the new and innovative medicines were antineoplastic and immunomodulating agents, anti-infectives, or targeting the gastrointestinal tract and metabolic diseases.
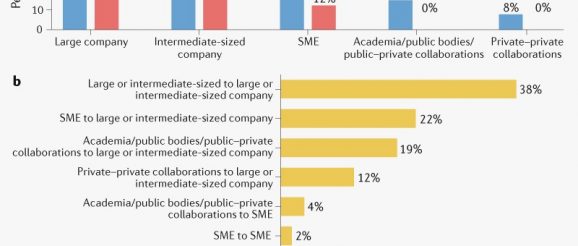
A summary of the profiles of the originator and marketing authorisation holder (MAH) for each of the 369 new and innovative medicines is shown in Fig. 1a and the full list is provided in Supplementary Table 1. Looking at MAHs, most were large (50%) or intermediate-sized (38%) pharmaceutical companies, and 12% were SMEs.
Fig. 1 | Sourcing of pharmaceutical innovation: 2010–2019. a | Originator and marketing authorisation holder for approved new and innovative medicines, divided according to organization type. b | Direction of product transfers between organization types during development. SMEs, small and medium-sized enterprises.
When the products were tracked back through development to their source, large or intermediate-sized pharmaceutical companies accounted for 54% of the products (large, 25%; intermediate-sized, 29%), SMEs for 23%, and academic/public bodies/public–private collaborations accounted for 15%. Private–private collaborations accounted for 8%.
The direction of product transfers between the different categories of originators and the eventual MAHs was analysed where applicable (Fig. 1b). Intermediary licensing activities were not considered. Of the 369 marketing authorisations for new and innovative medicines, 62% (227 out of 369) of these were subject to product transfers across the different categories of originators. The highest number of transfers was within the group of large or intermediate-sized companies (86 products, 38%), from SMEs to large or intermediate-sized companies (51 products, 22%), and from academic/public bodies/public–private collaborations to large or intermediate-sized companies (44 products, 19%). This resulted from out-licensing and mergers and acquisitions during development.
Regarding the regions where the research for these products emerged, 51% of the originators were based in North America (United States and Canada) and 32% in Europe (including the European Economic Area, Switzerland and the United Kingdom). International projects, the majority of which were transatlantic collaborations, accounted for 8%, and other countries accounted for the remaining 9%. Finally, there was an upward trend in the innovation output over a decade (Supplementary Box 1).
